Originally published at IDXInsights
Summary
We analyze the forward-looking predictability of a consensus-based ESG score specifically as it relates price volatility.
- We find that higher ESG scores are indicative of lower volatility over the following calendar year.
- This relationship is strongest for large cap stocks and is inverted for small companies.
ESG Overview
Investors’ focus on Environmental, Social and Governance (ESG) factors has increased dramatically in the last few years. Similarly, the number of companies now reporting ESG metrics has increased in a similar fashion and with it, the number of data firms providing this ESG information.
The issue, however, is that ESG scores are not standardized across providers and are, by nature, highly subjective depending on what the particular ESG data vendor deems important. This can (and does) result in ESG ratings that can be highly variable across company and time period making any kind of robust implementation difficult at best.
For this reason, we leverage the OWL Analytics database which uses a consensus approach to create their ESG scores that aggregates data from not only other ESG data providers but also hundreds of additional sources including NGOs, government databases, unions and activist groups.
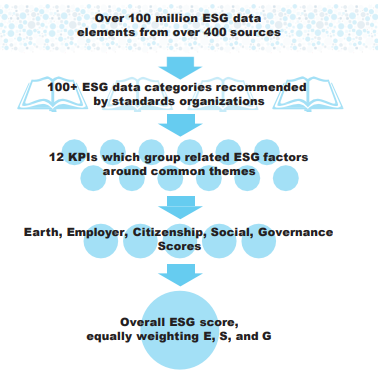
Source: Owl Analytics
A Look at OWL Analytics by the Numbers
The data analyzed comprise roughly 2,500 US companies from the period 2015 – 2020. The Owl ESG score was evaluated for each company on the last day of each calendar year and compared to the realized monthly price volatility over the subsequent calendar year.
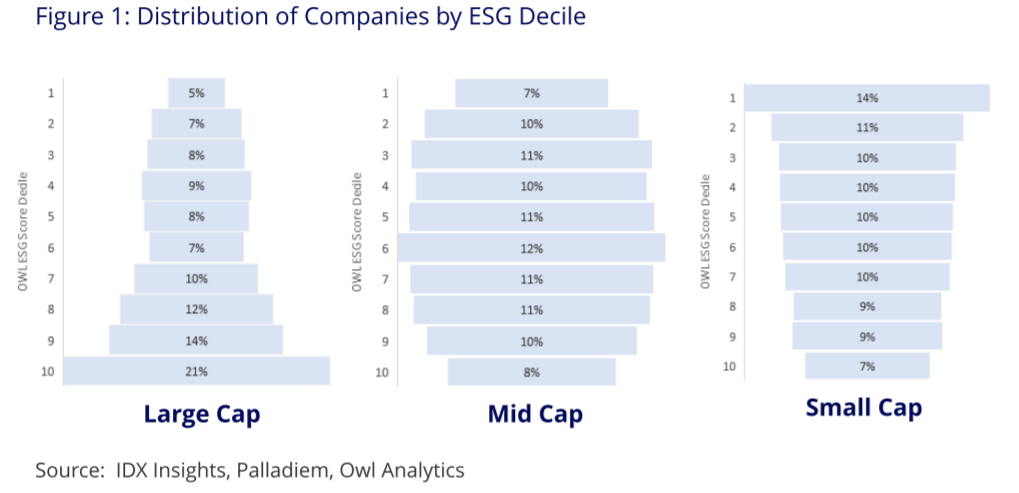
Large cap companies (defined as market cap of $10BN+) showed the highest concentration in the more favorable ESG deciles while Mid cap companies ($2Bn-$10Bn) were more evenly distributed and smaller companies were more likely to have lower ESG ratings.
This result is not surprising given the cost of implementing positive social, environmental or governance programs but it is interesting nonetheless to observe the reletave concentration of Large and Small companies in the More and Less favorable ESG deciles respectively:
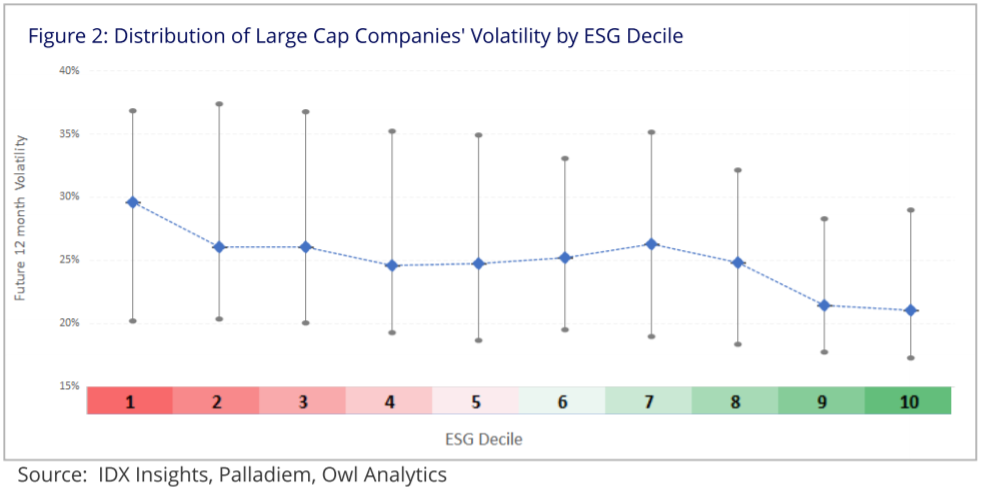
The dataset consisted of 447 companies that were classified as LargeCap companies. As previously outlined, for each company, the ESG score was evaluated on December 31st and compared to that company’s volatility over the following calendar year.
The chart below shows the distribution of those volatility calculations over the subsequent year (25th percentile, median and 75th percentile) for each ESG decile.
It can readily be seen that as the ESG decile improves, so to does the median volatility over the following year as well as the distribution of volatility outcomes.
Not only do large cap companies with higher ESG scores typically demonstrate relatively lower volatility in the following year but they do so with a higher degree of confidence (as evidenced by the narrower distribution).
This is important as it conveys a degree of confidence around the improved volatility profile…i.e., the likelihood of an investor realizing the volatility benefit associated with higher ESG scores across different states of the world:
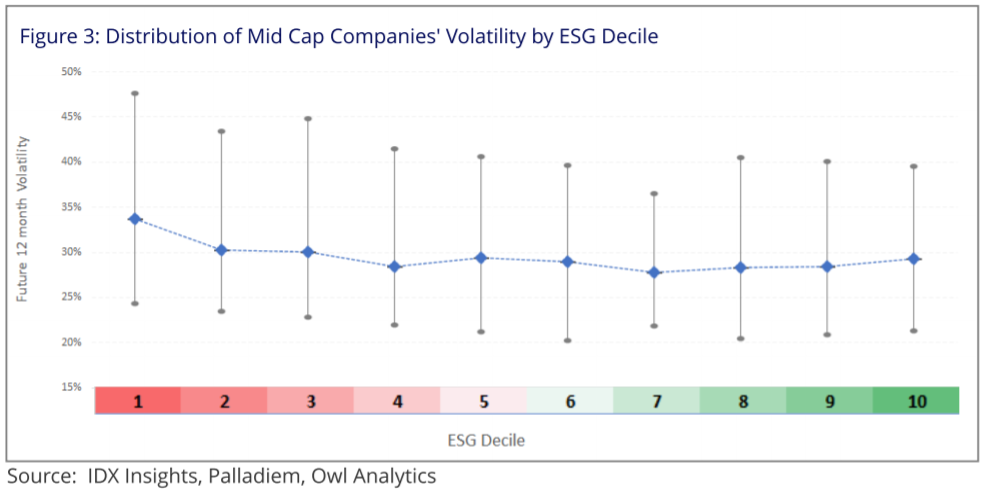
Looking at Midcap companies over this period, we see a more modest improvement in future volatility as ESG decile improves; although the improvement is notably more prominent among the 75th percentile volatility scores:
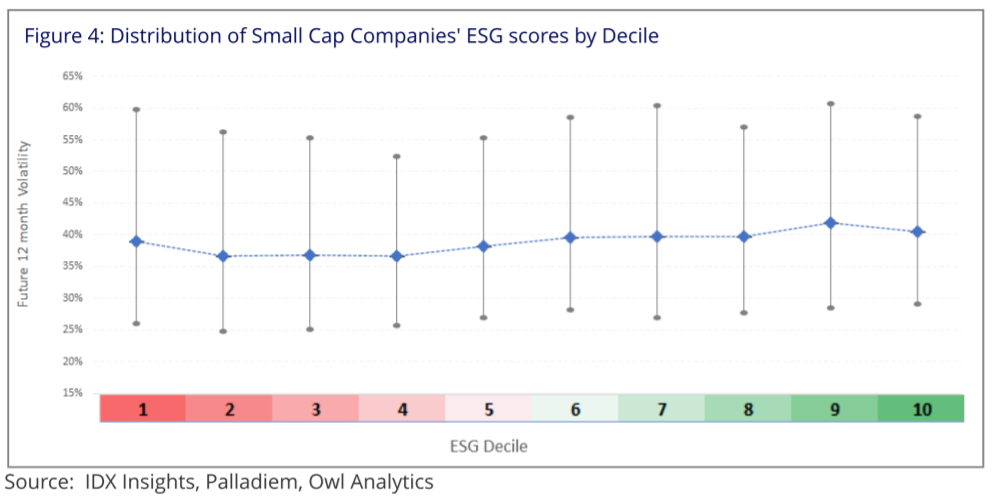
Perhaps most interestingly, is the reversal in this effect among small cap companies. As ESG scores improve, the smaller companies are more likely to demonstrate higher future volatility. Furthermore, we see an increase in future volatility even among the low-end of the distribution (the 25th percentile):
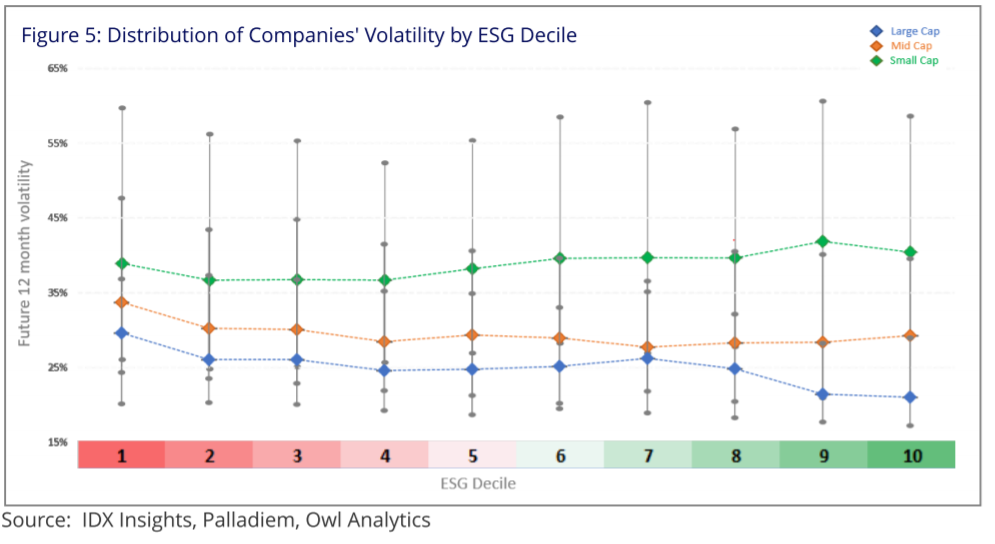
Noting the different scaling factors on the 3 previous charts, we superimpose the three below to more easily illustrate the marginal changes in volatility based on ESG decile across market caps:
Conclusion
As ESG solutions become more popular, it is both important and useful to understand the broad dynamics at play before implementing any kind of ESG score. While the robustness and intuitive appeal of consensus-based ESG scores are obvious, the evidence supporting their forward-looking predictive ability as it relates to volatility is equally appealing.
Importantly, the data reveals some interesting (although not entirely surprising) characteristics at play. Not surprisingly, larger companies tend to have higher ESG scores but also, ESG scores tend to be a better discriminator of future volatility among larger companies.
This effect is more muted among mid cap companies and slightly reversed among small companies. This is evidence of both an interesting area of further study as it relates to small cap companies as well a very useful framework for evaluating larger companies within a comprehensive ESG context.
Disclosures: This document has been provided to you solely for information purposes and does not constitute an offer or solicitation of an offer or any advice or recommendation to purchase any securities or other financial instruments and may not be construed as such. The factual information set forth herein has been obtained or derived from sources believed by the author and IDX Insights, LLC (“IDX”) to be reliable but it is not necessarily all–inclusive and is not guaranteed as to its accuracy and is not to be regarded as a representation or warranty, express or implied, as to the information’s accuracy or completeness, nor should the attached information serve as the basis of any investment decision. This document is intended exclusively for the use of the person to whom it has been delivered by IDX, and it is not to be reproduced or redistributed to any other person. The information set forth herein has been provided to you as secondary information and should not be the primary source for any investment or allocation decision. Information contained herein has been obtained from sources believed to be reliable, but not guaranteed. Forward-looking statements are not guarantees of future results. They involve risks, uncertainties and assumptions, there can be no assurance that actual results will not differ materially from expectations. Past performance is no guarantee of future results. No part of this material may be reproduced in any form, or referred to in any other publication, without express written permission from IDX. The information contained herein is only as current as of the date indicated, and may be superseded by subsequent market events or for other reasons. Charts and graphs provided herein are for illustrative purposes only. The information in this document has been developed internally and/or obtained from sources believed to be reliable; however, neither IDX nor the author guarantees the accuracy, adequacy or completeness of such information. Nothing contained herein constitutes investment, legal, tax or other advice nor is it to be relied on in making an investment or other decision. There can be no assurance that an investment strategy will be successful. Historic market trends are not reliable indicators of actual future market behavior or future performance of any particular investment which may differ materially, and should not be relied upon as such. This document should not be viewed as a current or past recommendation or a solicitation of an offer to buy or sell any securities or to adopt any investment strategy. The investment strategy and themes discussed herein may be unsuitable for investors depending on their specific investment objectives and financial situation. IDX provide links to third-party websites contained herein only as a convenience and the inclusion of such links does not imply any endorsement, approval, investigation, verification or monitoring by us of any content or information contained within or accessible from the linked sites. If you choose to visit the linked sites you do so at your own risk, and you will be subject to such sites’ terms of use and privacy policies, over which IDX.com has no control. In no event will IDX be responsible for any information or content within the linked sites or your use of the linked sites. Information contained on third-party websites that IDX may link to is not reviewed in its entirety for accuracy and IDX assumes no liability for the information contained on these websites. It is not possible to invest directly in an index. Exposure to an asset class represented by an index may be available through investable instruments derived from that index. IDX makes no representations regarding the advisability of investing in investment products based on the Index, which is not sponsored, endorsed, sold or promoted by IDX. Index returns do not reflect payment of certain sales charges or fees an investor may pay to purchase the securities underlying the Index or investment vehicles intended to track the performance of the Index. The imposition of these fees and charges would cause actual performance of the securities/vehicles to be lower than the Index performance shown. IDX gives no representations or warranties as to the accuracy of such information, and accepts no responsibility or liability (including for indirect, consequential or incidental damages) for any error, omission or inaccuracy in such information and for results obtained from its use. Information is as of the date indicated, and is subject to change without notice. This material is intended for informational purposes only and should not be construed as legal, accounting, tax, investment, or other professional advice.